In this article, we discuss in detail, why any SaaS founder needs a financial plan and how you can build one with Finmods SaaS.
Finmods SaaS is a financial Excel model for SaaS startups, that helps you to predict the future financial performance of a SaaS business.
It allows startup founders to input assumptions about their company’s growth, expenses, and revenue, and then see how those factors could impact the business’ bottom line.
The model can help founders make critical decisions about things like whether to raise additional capital or how much to charge for their product.
Let´s get right into it!
- Why Any SaaS Founder Needs a Financial Model
- Does a Micro-SaaS Solo-Founder also need a Financial Plan?
- The Benefits of a Financial Model
- DIY or Template?
- What can you do with Finmods SaaS?
- The One-Screen Assumptions Page
- The 3 Steps to Build Your Financial Model
- Marketing
- Website
- Growth of Organic Traffic in % / Month
- Conversion Traffic to User %
- Max. new organic users/mo
- Ads
- PPC Budget/mo
- Increase of Budget in %/mo
- Conversion Click to User in %
- Max. PPC budget / mo
- Size of Email List M1
- Optin Rate User to Email
- Sent Emails/mo
- Conversion Email to User %
- Email Provider Fee/mo
- Copywriting cost/email
- Influencer
- Follower/Influencer
- Organic Reach
- Conversion reached follower to user %
- Cost per shoutout
- Shoutouts/mo
- Increase of Shoutouts in %/mo
- Sales Reps
- Contacts/sales rep/day
- Conversion contact to user %
- Workdays/week
- Ways to Increase Revenue by Growth
- Revenue
- General
- Expenses
- Finance
- Summary & Charts
- How to Plan Your Staffing (Personnel)
- Marketing Data
- The Three Statements
- Conclusion
Why Any SaaS Founder Needs a Financial Model
When starting a software as a service (SaaS) business, having a financial model is key to success.
- A financial model helps you to gain a deeper understanding of your business. You can develop successful marketing campaigns, you get a strong foundation to decide on pricing, and you get a better idea about the impact of churn, conversion, and MRR.
- The model supports the founder’s motivation. When you have a bad day, you open your financial model to reflect on your goals and the future you are currently shaping.
- The financial model shows how to make the business profitable and how to stay on track.
- Creating a financial model forces the founder to think through all the expenses and revenue streams of the business. This level of detail is essential in order to make sound decisions about pricing, hiring, and investment.
- A financial model also helps when raising capital. It can also be used to show potential investors how the business will be profitable and what return they can expect on their investment. Investors want to see that a company has a clear path to profitability and that they are not just shooting in the dark with their ideas.
Thus, a well-crafted financial model is an essential tool for any SaaS business.

Does a Micro-SaaS Solo-Founder also need a Financial Plan?
Some have the misconception that solo entrepreneurs with no outside funding don’t need a financial plan. This is a serious mistake that significantly reduces a startup’s chances of success.
The Disadvantages of not having a Financial Plan
- No deeper understanding of the economic context.
- Weak decision-making basis for pricing and staffing.
- Increased uncertainty when making decisions and increased risk of bad gut decisions.
- Less sense of achievement and less motivation because you have no concrete goals to achieve.
- You don´t know how much capital you need until you reach break-even sales.
The Advantages of a Financial Plan
- A deeper understanding of pricing, churn, conversion, CAC, LTV, MRR, and profits.
- Higher motivation because you can pursue and achieve specific goals.
- You know what to do to reach the break-even point, when this will probably be and how much money you need to invest into your startup.
- You are ready to raise capital from investors.
- Massively increased chances of success.
So, yes, a bootstrapping solo founder needs a financial plan as well as a 2-year old startup that raises capital to finance growth.
The Benefits of a Financial Model
A financial model is a critical tool for any startup, but especially for a software-as-a-service (SaaS) business. The model should include all potential expenses and revenue scenarios, so you can accurately gauge your business’s profitability and financing needs.
Too often, startups focus exclusively on marketing efforts that generate the most leads, without considering all of the associated expenses. A financial model can help you determine how much profit each marketing campaign generates, so you can allocate your budget most effectively.
Additionally, a financial model can help you anticipate future revenue streams and make better decisions about when to scale up your business. By considering all possible expenses and revenue scenarios, you can be confident that your SaaS business is on sound financial footing.
Finally, a financial model will help you to determine how much money you need to start and grow your business.
DIY or Template?
There are two options when creating a financial model: self-created or ready-to-use template.
The Do-it-yourself Route
If you choose to create your own financial model, it is important to include all of your costs and revenue projections. This will help you to make informed decisions about your business. In any case, it is essential to be realistic when projecting your numbers, so you don’t set yourself up for failure.
The main advantages of self-created models are to save some money and to get a model, that exactly fits the needs. But there are also cons of self-created models. Formula mistakes can deliver wrong results and influence the chances of success badly.
If you are not experienced with building financial models, you will spend a lot of time with the basic structure, that you could use otherwise to improve your business plan or your product.
Although I have years of experience in this area, it took me about a month to build Finmods SaaS, until it had the quality I want to deliver to my customers. If you skip quality control, you risk mistakes, that can become expensive.
The Expert-Built Template
If you choose an expert-built template like Finmods SaaS, be sure to find one that fits your business. A model that is too general won´t provide the assumptions you need for your industry, and the template should include all of the relevant information about your business, such as marketing, conversion, churn, expenses, revenue, profit, and finance.
If you can get an expert-built and industry-specific template at a reasonable price, the pros overweight the cons.
The benefits of Finmods SaaS are:
- The One-Screen-Assumptions page is unique and very helpful when building your financial plan. Assumptions and results on one page support intuitive modeling and make the creation of your financial plan easy. You can immediately see the impact of any change, which helps you with optimizing your inputs.
- It´s built by an expert.
- You get a quality-checked product.
- Cells with formulas are protected to avoid accidental damage (Only MS Excel supports this feature; Google Sheets does not).
- You can edit the model to adapt it to your specific needs.
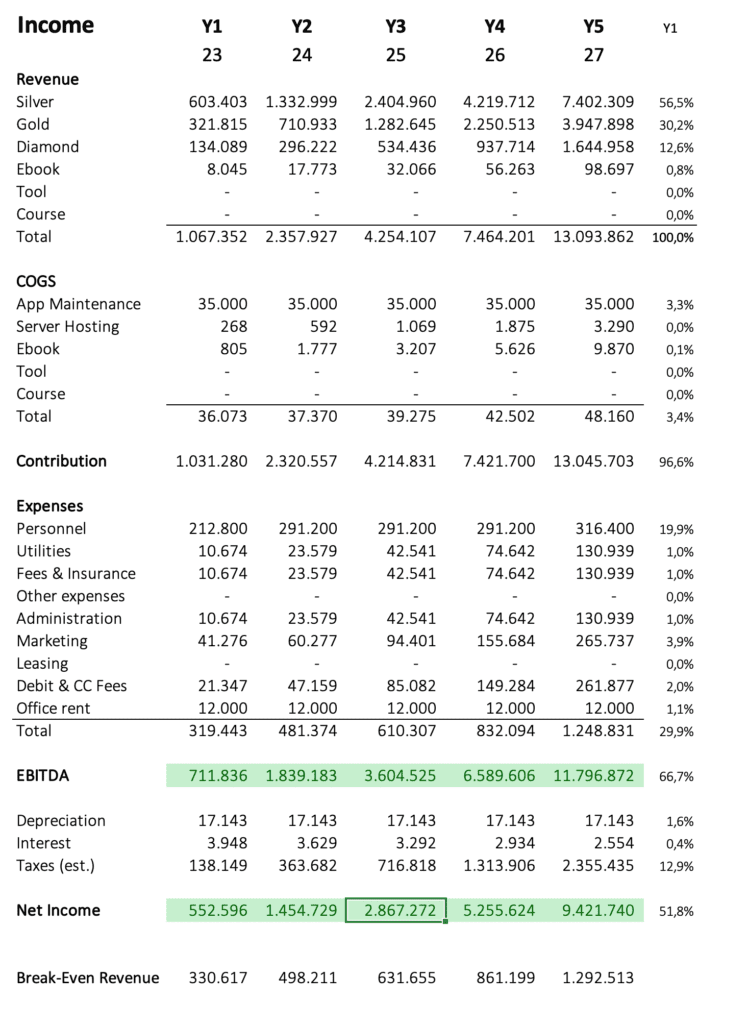
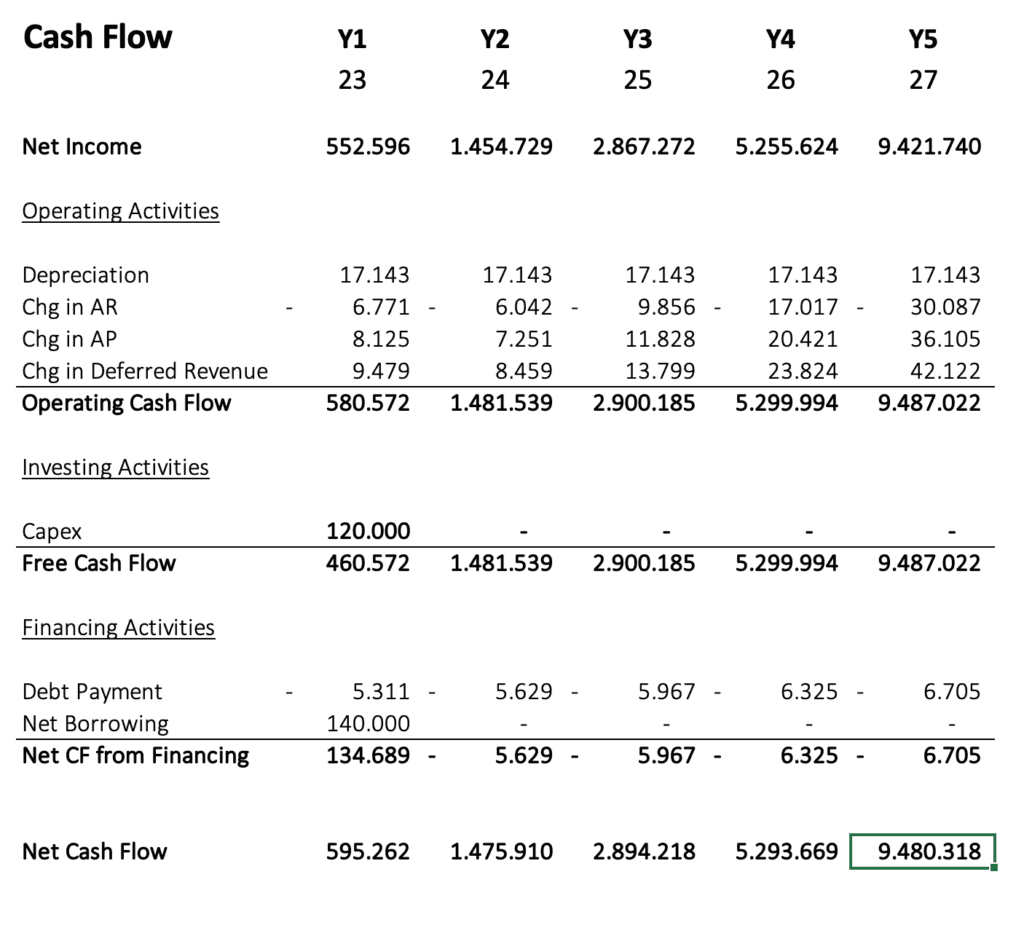
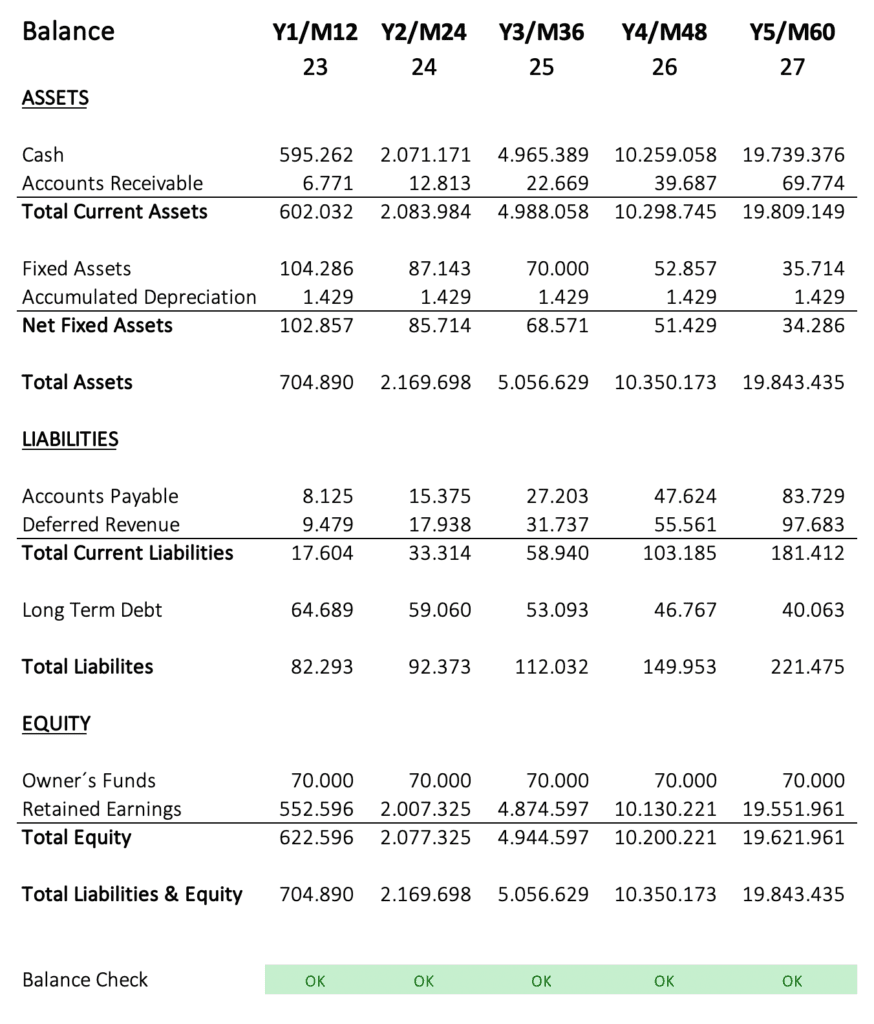
- All three statements for income, cash flow, and balance are created automatically for 5 years (Giga version includes all three statements; the Mega version includes only the income statement).
- Fee model with 3 different subscriptions and 3 in-app purchases.
- Professional plan to convince investors and financiers.
- Important key performance indicators like MRR, CAC, ULTV, COGS, EBITDA, Churn, and much more.
- No macros were used, so no problems from this side.
- Multiple Charts (Only MS Excel supports all included charts; Google Sheets does not show all charts correctly).
- You can create your financial plan in 1 or 2 hours.
- 44 min Video Tutorial included.
- Perfect for Beginners and Pros.
- Low price.
What can you do with Finmods SaaS?
- Demonstrate to partners, employees, and investors, that you know your numbers.
- Convince financiers to invest in your business.
- Enter your assumptions into the yellow cells to find out, whether your business will be profitable or not.
- Build a 5-year forecast for income, cash flow, and balance.
- Stay motivated, as you can see the success story you are creating right now.
- Determine the necessary capital to start your business. Tip: The monthly cash balance always needs to be positive to maintain liquidity. A negative monthly cash balance will be marked red automatically as a warning sign.
- Find prices, that support your profit goals.
- Plan 5 different marketing campaigns, that increase profit (website, ads, email, influencer, sales reps). Tip: If the UAC of a certain marketing campaign is lower than ULTV, the campaign is profitable.
- Discover the power of email marketing.
- Learn about the impact of user churn.
- Find out, how much money you can make with your software business.
- Determine how many employees you can afford to hire.
- Calculate, how many customer service employees you need.
- Determine financing by equity and by loan.
- Calculate a complete loan schedule with monthly payment, interest, principal, and balance.
- Consider essential costs like server hosting, app maintenance, customer service, rent, expenses, and payroll tax.
- Easily print the 5-year statements for income, cash flow, and balance, or create screenshots for your pitch deck.
- Research KPIs, charts, and marketing data to refine your financial plan.
- And more!
The One-Screen Assumptions Page
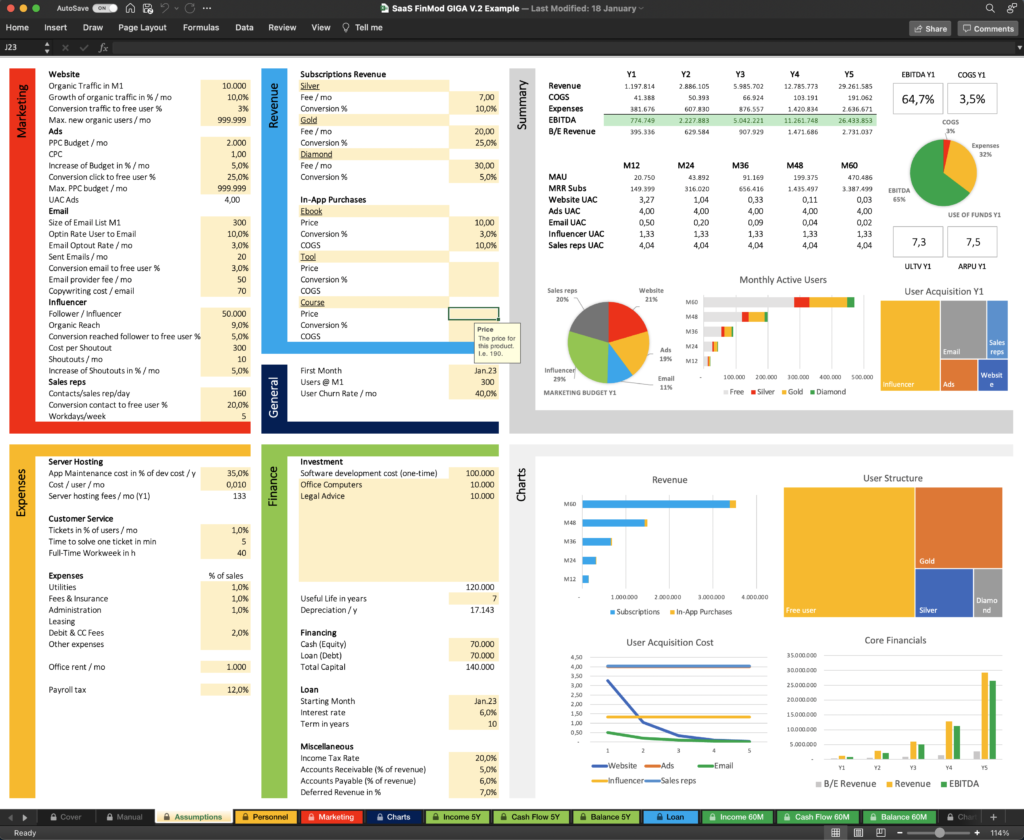
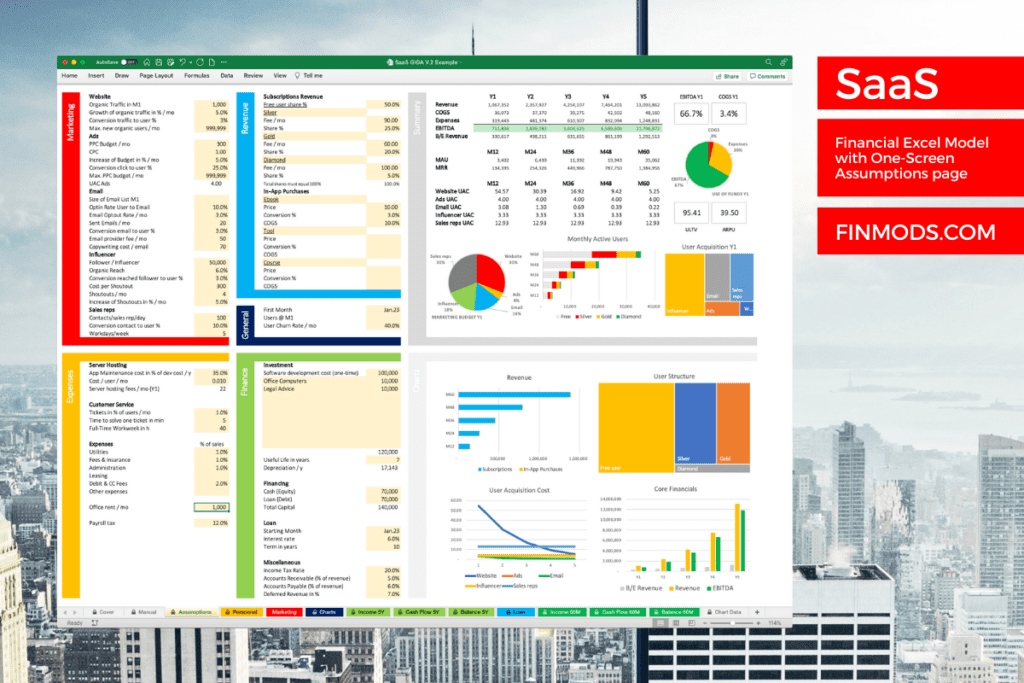
The Assumptions Tab is the heart of Finmods SaaS. Here you find almost all input fields (yellow marked), that you can populate with your values. I call it the One-Screen Assumptions page, as you find the assumptions and the results on one screen.
This design creates a huge benefit. When you enter a value, you immediately see the impact on your core financials. When you increase a subscription fee, you can read the new numbers for revenue and profit. This feedback makes financial modeling much easier and it supports your intuition. You can simply start with your best guess and optimize until you are happy with the results.
The 3 Steps to Build Your Financial Model
The process of working with Finmods SaaS can be broken down into three basic steps.
- Step 1 Enter
- Step 2 Observe
- Step 3 Optimize
Step 1 Enter Your Assumptions
Enter your assumptions into the yellow marked cells. An assumption in a financial Excel model is an input that is forecasted or estimated. The assumption may be based on historical data, market trends, or other factors. The assumption helps to ensure that the financial model is as accurate as possible. It is important to use assumptions that are reasonable and realistic.
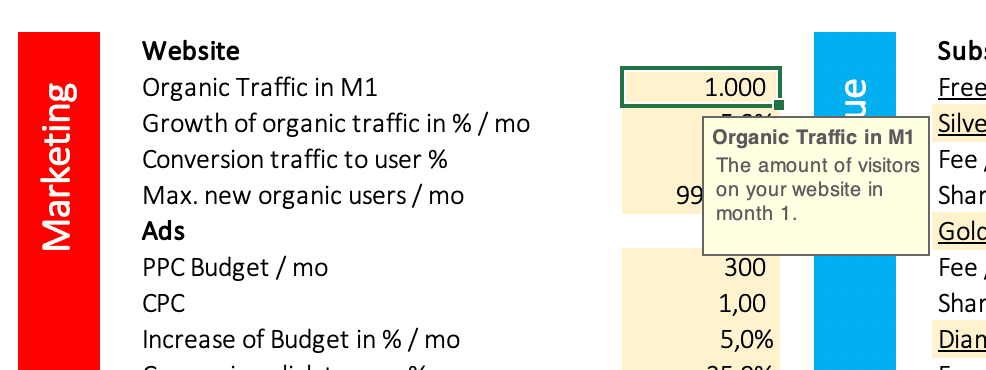
When you click on a yellow cell, you get tips and info. Picture 1 shows the input fields for your website.

Step 2 Observe the Results
As soon, as you populated all or most yellow cells with your assumptions, you can observe the financial results like revenue, COGS, Expenses, and EBITDA on the right side of the assumptions tab. The core financials tell you how profitable your planned business is and provide helpful data to understand the connections.
Step 3 Optimize the Model
Now is the time to optimize your financial plan. From observing the results, you know the outcome of your current assumptions. To improve your model, take one assumption after another and test a different value. I.e. you estimated the organic traffic of your website in month one with 1,000 visitors. You could assume higher traffic of 2,000 visitors and discover the impact on your financials.
Of course, your inputs need to be realistic. So, when entering a value, you need to question, if this is doable and what you need to do to reach this goal. If you are not sure, industry benchmarks can be a helpful guide. When you click on a yellow input cell, some infoboxes contain such benchmarks or give a hint.
You can google a certain benchmark you are looking for with a search query like this: “software benchmark conversion rate”. You find an answer from Adoric, that a good conversion rate is between 2 and 5%. You can dig deeper into the search results to find out the circumstances of a benchmark and how applicable they are for your financial model. If you are a completely new startup without any historical data, this process can be very helpful to create a reliable financial plan. As your business evolves and as you collect your own data, you can implement them in your model and improve it more and more.
Next, we go deeper into the process of modeling your financial plan by having a look at every single assumption.
Marketing
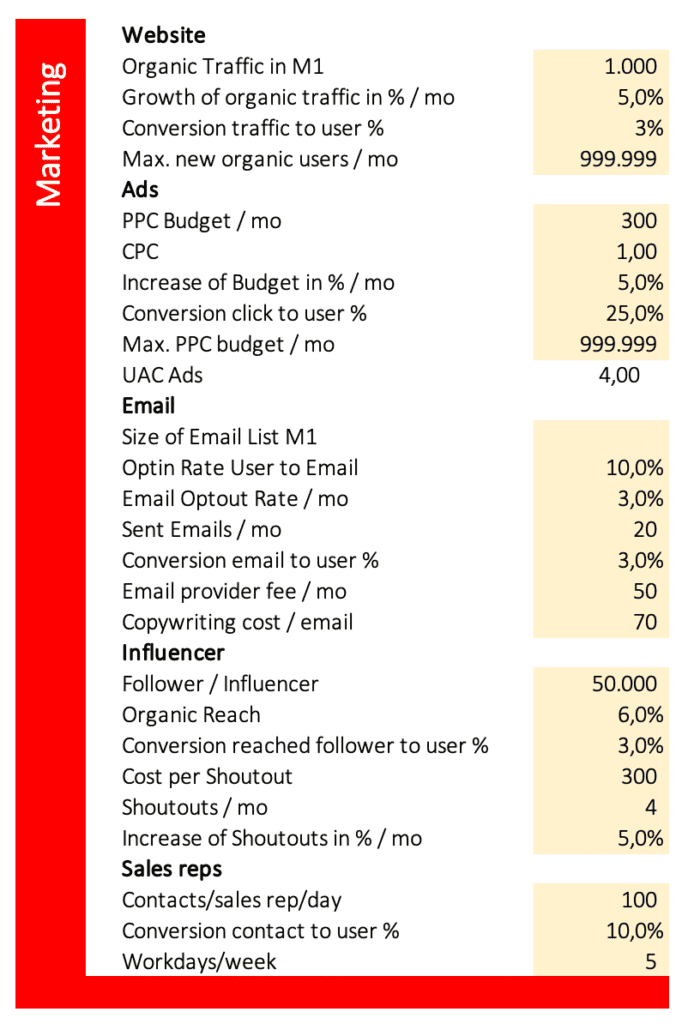
The marketing area provides five different marketing campaigns you can model.

Website
Content marketing with a blog is a strategic marketing approach focused on creating and distributing valuable, relevant, and consistent content to attract and retain a target audience. The goal is to create customers for life by providing them with the information they need when they need it. This can be done through a blog, articles, videos, or any other type of content that is relevant to your target market.
Organic Traffic in Month One
Organic traffic is a type of website traffic that results from unpaid search engine results. These results are often called “organic” because they are not paid for like traditional advertising. Instead, organic traffic is generated through the natural process of search engine optimization (SEO).
The assumptions represent the number of organic visitors in month one. To get any numbers, you need a value higher than zero. I.e. 1,000 visitors in month one.
Growth of Organic Traffic in % / Month
The percentage increase in website traffic per month. I.e. 5% per month.
Conversion Traffic to User %
The percentage of traffic that is converted to users is a measure of how successful a website is at converting visitors into customers. This figure is calculated by dividing the number of users who signed up for your software (free and paid) by the total number of visitors who came to the site. I.e. 3% of visitors sign up for your software (free and paid). You can differentiate between free and paid users when modeling your revenue.
Max. new organic users/mo
This number works like a cap to avoid unrealistic high numbers because of exponential growth. If this cell has no entry, the maximum number of new organic users per month is zero. If you don´t want to limit growth, just enter a very high number like 999,999.
Ads
Online PPC ads are a form of internet marketing that uses paid search engine advertising to generate clicks on a company’s website. Advertisers bid on keywords and create ads that are displayed when someone searches for those keywords on a search engine. When someone clicks on the ad, the advertiser pays the search engine for the click.
PPC Budget/mo
The money you spend on PPC ads per month. I.e. $300.
CPC
CPC is a metric that measures the cost-per-click of an advertising campaign. It is calculated by dividing the total cost of the campaign by the number of clicks that the campaign generated. This metric is important for advertisers because it helps them to determine how much they are spending per click and whether or not the campaign is generating a positive return on investment. This Wordstream article provides CPC benchmarks by industry; i.e. $3.33 for B2B search ads.
Increase of Budget in %/mo
The proportional increase of your advertising budget each month. I.e. 5% per month.
Conversion Click to User in %
The percentage of ad traffic that is converted to users; i.e. 25%.
Max. PPC budget / mo
You can limit your maximum monthly ad budget to a certain amount; i.e. $1,000. If you don´t want to cap your PPC budget, enter a very high number like $999,999.
Email newsletters are a great way to market products because they allow you to target a specific audience and send them information about your product. You can also use email newsletters to build relationships with potential customers and keep them updated on your product. To create an effective email newsletter, you need to consider your target audience, the content of your newsletter, and the design. You also need to make sure that your newsletter is easy to read and that it includes a call to action.
To execute email marketing, you need an opt-in form to enable the sign-up of website visitors. Then you can send email messages to your list, that contain helpful info and promotion for your software.
Size of Email List M1
The number of email addresses you already have collected in month one. If you have none yet, enter zero or leave this cell blank.
Optin Rate User to Email
The opt-in rate of users to email is the percentage of all software users (free and paid) who also sign up to receive emails from you. If you make the email signup a requirement for getting a free user account, this rate can be 100%. If you make the email signup an option, this value should be at least 2%. According to Sumo, the average email opt-in-rate is 1.95% and the top 10 of marketers average an 4.77% opt-in-rate.
Email Opt-out Rate/mo
The percentage of all email newsletter subscribers, that opt-out from your list per month. I.e. 3%. According to OptinMonster, an unsubscribe rate below 0.5% is a good one; please note, that this number refers to one campaign/sent email message. Your monthly opt-out rate will depend on the number of sent messages to your email list. 4 messages per month * 0.5% opt-out would equal 2% opt-out per month.
Sent Emails/mo
The amount of email messages you send to your Email list per month to promote your business. I.e. 20.
Conversion Email to User %
The percentage of Email recipients, that convert to users of any sub of your software (free and paid). I.e. 3%.
Email Provider Fee/mo
The monthly fee yo pay to use a professional Email service like GetResponse. I.e. $49 per month.
Copywriting cost/email
The fee you pay to a copywriter to create one compelling Email message, that promotes your software. I.e. $70. If you write the emails yourself, you can enter zero.
Influencer
Influencer marketing is a form of marketing that focuses on using key individuals known as influencers to drive a brand’s message to a wider audience. These influencers can be bloggers, social media stars, or even industry experts, and through their connections and reach, they are able to help promote a brand to a larger group of people.
Follower/Influencer
The average number of followers of influencers, that promote your software. I.e. you could choose only influencers, that have a following of about 50,000.
Organic Reach
Only a small fraction of followers will actually see the influencer’s post, that promotes your software. Organic reach is the percentage of followers, that will see it; i.e. 9%. This metric varies wildly and depends on many factors like platform, account size, and type of post. According to Hootsuite, the organic reach on a Facebook page is around 5.2%. Quintly published, the organic reach of an Instagram Story for accounts with 50k-200k followers is 3.5%.
Conversion reached follower to user %
The percentage of reached followers, that become a user (free and paid) of your software. I.e. 3%.
Cost per shoutout
The fee you pay to an influencer to promote your software within one post (shoutout). I.e. $300. Macarthy published the average influencer prices of $100 – $500 for micro-influencer with 10-100k followers. If you run your own social media account, set this value to zero.
Shoutouts/mo
The number of shoutouts from influencers, that you buy per month; i.e. 10.
Increase of Shoutouts in %/mo
The increase of shoutouts in percent per month; i.e. 5%.
Sales Reps
One common way to sell software is through a sales representative. A sales representative will work with a customer to understand their needs and then recommend the right software for them. They will also help the customer to understand how the software works and how it can benefit their business. Sales representatives are often very knowledgeable about the software they are selling and can answer any questions that the customer may have.
Contacts/sales rep/day
The number of contacts a sales rep makes to prospects, that might be interested in your software per day; i.e. 100.
Conversion contact to user %
The percentage of contacted prospects, that convert to users of any sub of your software (free and paid); i.e. 10%.
Workdays/week
The number of days, your sales reps work per week; i.e. 5.
Ways to Increase Revenue by Growth
If you want to increase revenue growth, you can change the growth assumptions. The main growth drivers in this model are within the marketing section in the tab “Assumptions”:
- Website: Growth of organic traffic in %/mo
- Ads: Increase of Budget in %/mo
- Influencer: Increase of shoutouts in %/mo
Further, you can increase employee assignments in the tab “Personnel” for sales reps.
The growth of Email marketing is dependent on getting new Email subscribers from the other four marketing channels; thus no lever to increase the growth of Email.
Revenue
The revenue of a software business is the total amount of money that the business earns from selling its products and services. This can include revenue from sales of software licenses, support contracts, and other services. The revenue can also be affected by discounts, rebates, and other incentives offered to customers.
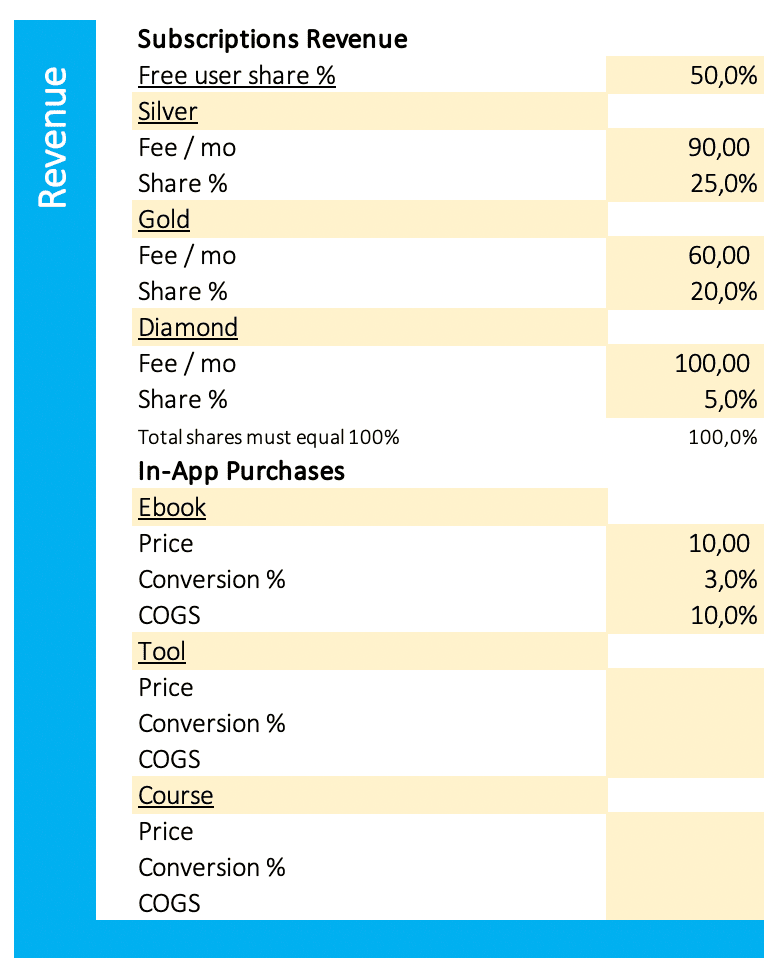

Subscriptions Revenue
The subscription revenue of a software business is the total revenue generated from subscriptions to the software. This revenue can come from new subscribers, as well as renewing subscribers. It can also come from upgrades and additional features that are purchased by subscribers. This revenue is important to businesses because it represents a stable and recurring stream of income.
Free User Share %
The percentage of all users (free and paid), that subscribe for a free plan; i.e. 50%.
Subscription Plans 1-3
Finmods SaaS provides three different paid subscriptions and you can name each one.
Fee/mo
The monthly fee you get for a certain subscription plan. I.e. $90 for the Plan “Silver”.
Share %
The percentage of all users (free and paid), that buy a paid subscription; i.e. 10%.
Total Shares (free and paid) must equal 100%
The sum of free users and all three kinds of paying users must be 100%; otherwise, the result field becomes red as a warning sign, because some results will not be accurate.
In-App Purchases
In-app purchases are a way for developers to make money on their apps. Users can purchase in-game items, bonus levels, or subscriptions from within the app. This allows them to continue using the app without having to leave and make a separate purchase from a different app or website. In-app purchases can be made with a credit card, Apple Pay, or PayPal.
Finmods SaaS provides three different in-app purchases like ebooks, tools, or courses, and you can freely name the products.
Price
The price a product you sell in your app; i.e. $10 for an ebook.
Conversion
The percentage of users (free and paid), that buy a certain product; i.e. 3%.
COGS
The cost of goods sold in percent of the sales price; i.e. 10%.
General


First Month
The month your business starts; i.e. Jan 2024.
Users @ M1
The number of users (free and paid)
User Churn Rate/mo
The percentage of users you lose each month. Enter a number between 0 and 1 or 0% and 100%. Tip: 100/months = Churn rate per month in %. Example: A user stays loyal for two months on average. 100/2=50% churn rate / month.
Churn rate is the percentage of customers who cancel their subscription to a software service over a given period of time. This metric is used by companies to measure how successful they are at retaining customers. A high churn rate can be a sign that a company’s products are not meeting customer needs, or that it is not doing a good job of marketing and selling its services.
Expenses
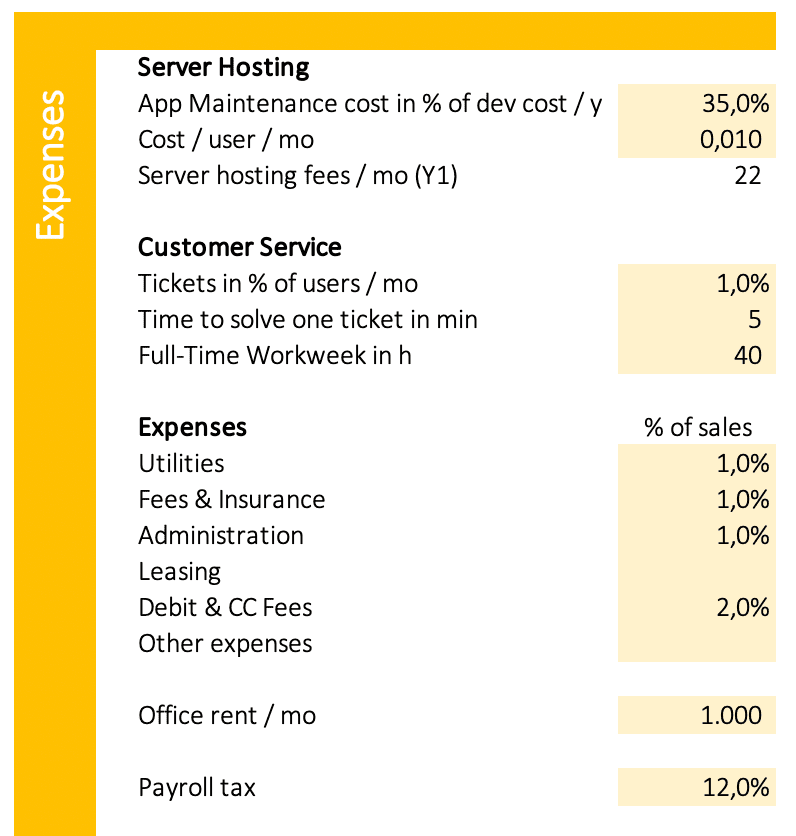

Server Hosting and App Maintenance
The expenses associated with server hosting and software maintenance can be significant. Servers must be housed in a secure location, and they require round-the-clock monitoring and maintenance to ensure that they are running properly. In addition, software updates and security patches must be applied on a regular basis, which can add up to a significant expense.
App Maintenance
Developing an app is a costly and time-consuming process, but maintaining it over the long term can be just as expensive. Many app developers report that they spend 20 to 50 percent of the original development cost on ongoing maintenance each year. This typically includes fixing bugs, updating the software to keep up with changes in iOS or Android, and adding new features. It’s important to budget for these costs when creating your original development plan.
Enter a percentage of development cost as maintenance cost per year; i.e. 30%.
Server Hosting Cost/user/mo
The server hosting cost per user per month. These costs depend very much on the needed bandwidth for data exchange; i.e. $0.01 for an app with low bandwidth needs. The costs for an app with high bandwidth needs can be much high. You need to estimate your needs and compare prices.
Customer Service
Customer service for software is the provision of support to customers who have purchased or are using the software. This support can come in the form of online help, telephone support, or on-site support.
Tickets in % of users/mo
The required number of customer service tickets in percent of users per month; i.e. 1%.
Time to solve one ticket in min
The average time to solve a customer service ticket in minutes; i.e.5.
Full-Time Workweek in h
The number of hours your customer service employees work per week; i.e. 40.
Expenses in % of sales
Utilities: The cost related to electricity, heat, sewer, and water in percent of sales; i.e. 1%.
Fees & Insurance: General liability, errors, and omissions, commercial property etc; i.e. 1%.
Administration: Bank charges, travel expenses, entertainment, office supply, repair, accounting, legal etc; 1%.
Leasing: Rent or fees for using cars, machines, computers, software etc; i.e. 1%.
Debit & CC Fees: The payment fees for debit- and credit cards are about 2 to 4% of sales.
Other Expenses: Further costs you may want to consider.
Office rent/mo
The rent for your office per month; i.e. $1,000.
Payroll tax
A percentage of wages; i.e. 12%.
Finance
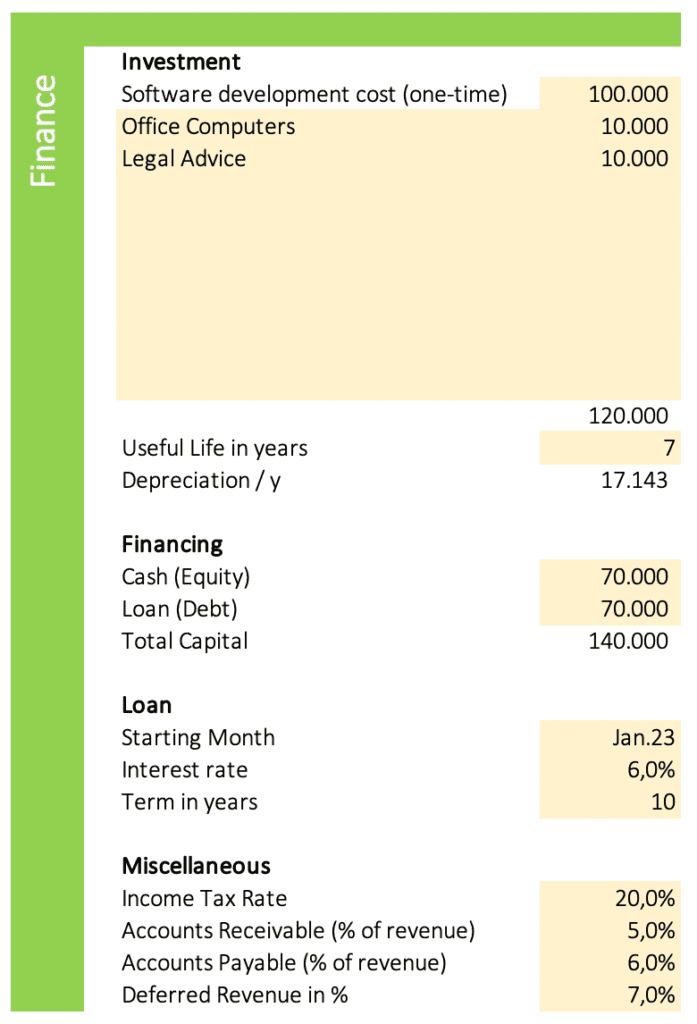

Investment
The investments include one-time costs to develop your software or to buy necessary assets like computer hardware. The necessary investments of a software startup vary depending on the specific industry, but typically include costs for developing and marketing the product, hiring employees, and renting office space or other work facilities. In order to bring a new software product to market, startups often need to invest in research and development to create a prototype, as well as marketing efforts to generate awareness and interest in the product. Sales and customer service teams may also need to be hired in order to support the early customers of the product.
Useful Life in Years
The useful life of an asset is the length of time it is expected to provide benefits to the company. Enter the average period of how long you expect to use your assets; i.e. 7 years. This input is necessary to calculate depreciation.
Financing
There are a variety of ways in which a startup can finance itself. The most common are through equity or loans. Equity financing comes in the form of investments from the founder, venture capitalists, or angel investors. In exchange for their investment, these investors typically receive a share of the company’s ownership. Loan financing can come from a number of sources, such as a bank or an individual investor. The company will need to repay the loan with interest over a set period of time.
Cash (Equity)
Your own money you invest into your business; i.e. $70,000.
Loan (Debt)
The money you borrow from banks or investors to finance your business; i.e. $70,000.
Loan Starting Month
Then month your loan starts; i.e. Jan 24.
Loan Interest rate
The interest rate of the loan; i.e. 6%.
Loan Term in years
For example, 10 years.
Income Tax Rate
The tax rate for your income; i.e. 20%.
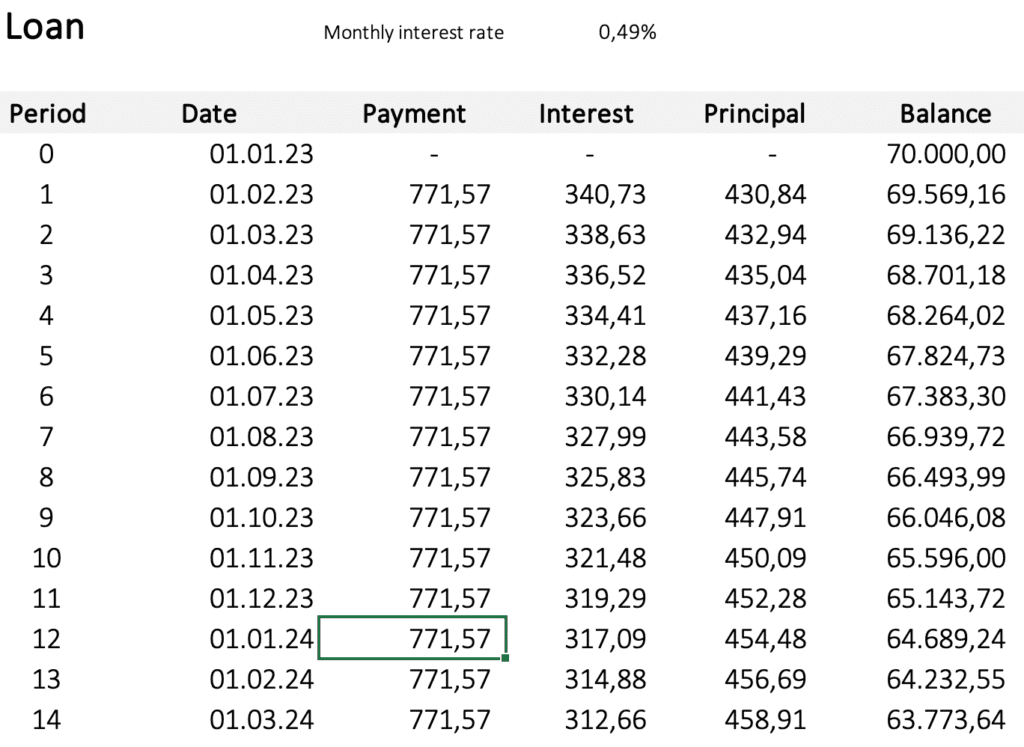

Accounts Receivable (% of revenue)
AR is the money due to your business but not yet paid for by customers. This is part of the cash flow calculation; i.e. 5%. Note: AR, AP, and Deferred Revenue are only included in the version Giga.
Accounts Payable (% of revenue)
AP is money owed by your business to its creditors. Part of cash flow calculation. I.e., 6%.
Deferred Revenue (% of revenue)
Also known as unearned revenue; it refers to advance payments a company receives for services that are to be delivered in the future. Part of cash flow calculation. I.e., 3%.
Summary & Charts
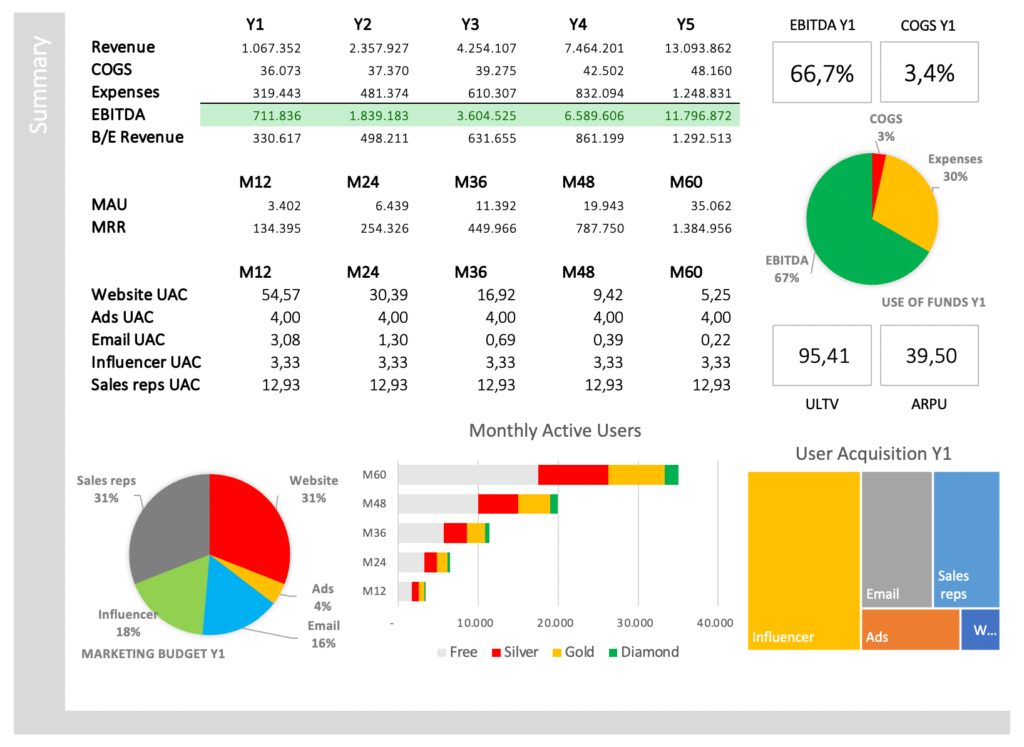
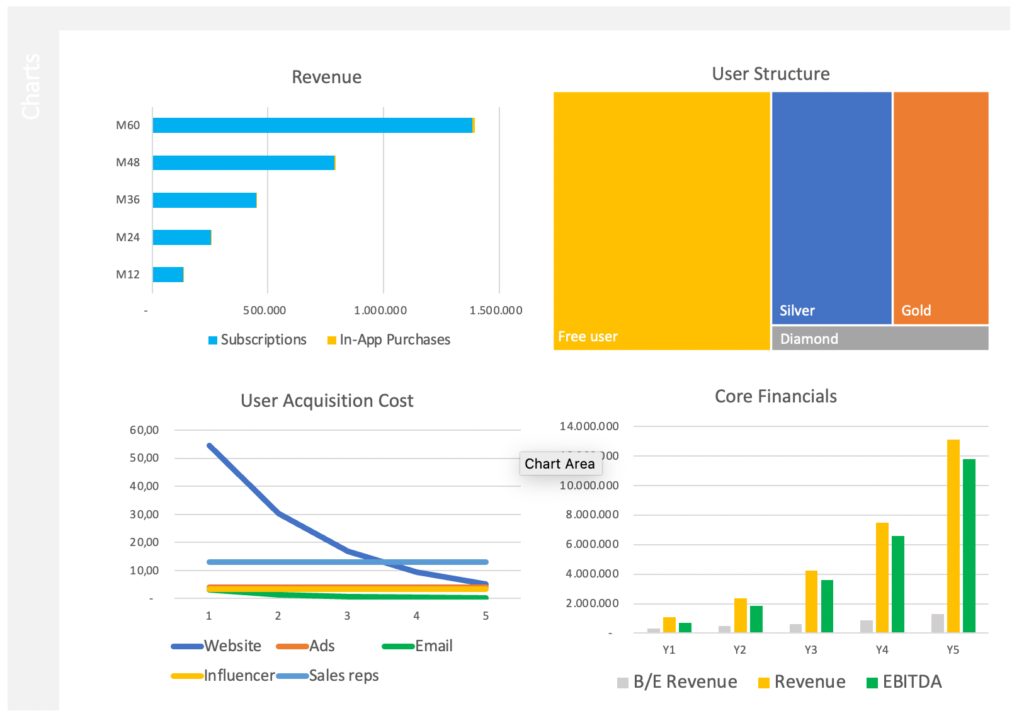
Summary and charts provide you with core financial data: Revenue, COGS, expenses, EBITDA, Break-even Revenue, MAU (monthly active users), MRR (monthly recurring revenue), UAC (user acquisition cost), ULTV (user lifetime value), ARPU (average revenue per user), Marketing Budget, and User Structure.


How to Plan Your Staffing (Personnel)
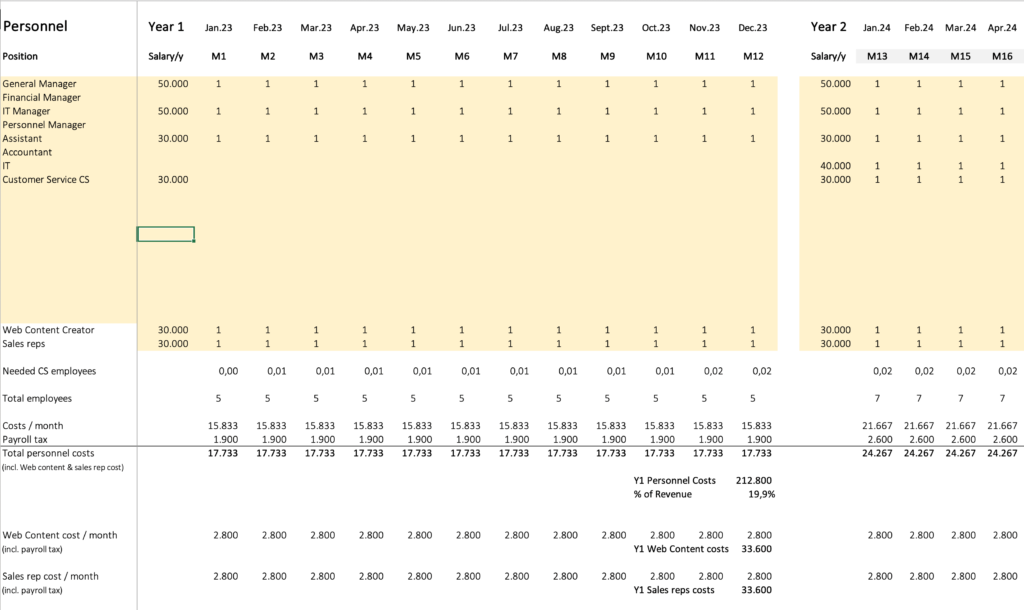

The tab “Personnel” helps you to plan your staffing. You can plan each year and each month separately by scrolling horizontally to the right.
Position
Define the positions in your business; i.e. General Manager, CTO, Assistant, Customer Service, IT, etc.
Salary/y
Determine the salary for each type of position per year; i.e. $50,000.
M1, M2, M3, etc.
You can assign a certain number of employees to each position in each month. Enter “1” in M1 to assign one employee in month one for a certain position. You can assign multiple employees per position per month; i.e. 2 or 25. Enter salaries and employee assignments for all five years to get a complete personnel plan.
Web Content Creator
This position for web content creator cannot be edited, because the referring inputs are used to calculate Website UAC (User Acquisition Cost). This type of employee creates articles and other kinds of content for your website to attract organic traffic.
Sales Reps
This position for sales reps also cannot be edited, as the referring inputs are used to calculate Sales Rep UAC. Sales reps are meant to contact prospects, present your software and sell it.
Marketing Data
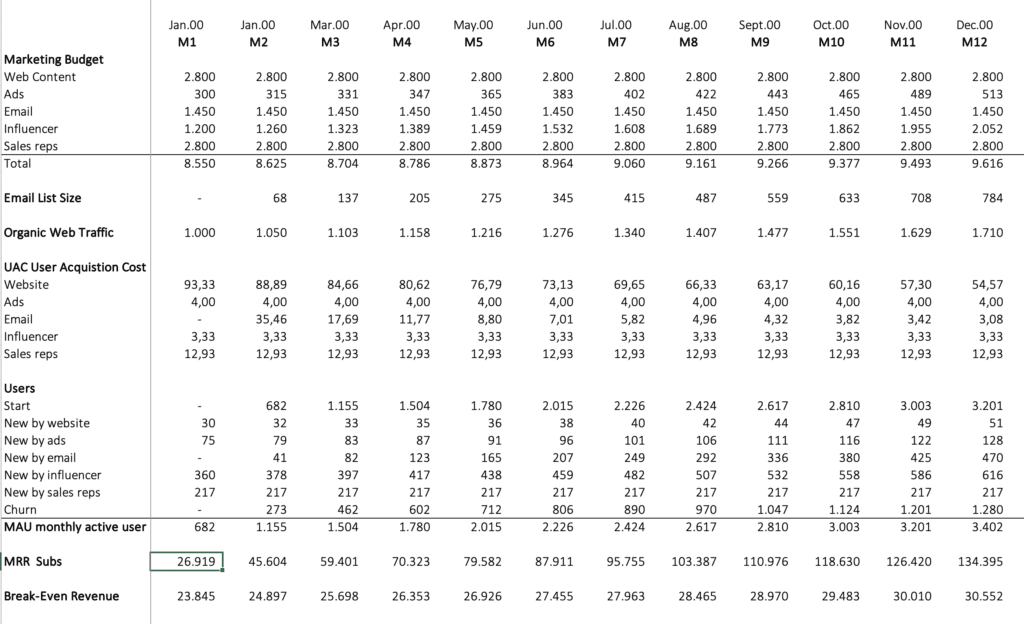

The tab “Marketing” provides detailed data:
- Marketing Budget for web content, ads, email, influencer, sales reps
- Email List Size
- Organic Web Traffic
- User Acquisition Cost for each marketing campaign
- MAU monthly active users
- MRR monthly recurring revenue
- Break-even Revenue
The Three Statements
As a result, you get monthly and yearly statements for income, cash flow, and balance, which you can screenshot and insert into your pitch deck.



Conclusion
As soon as you entered most or all assumptions, you can start to optimize your financial model until you are happy with the result. After creating the first draft, I recommend pausing for a day, to come back with fresh eyes.
Don´t forget to check out my 44-min Video Tutorial, where I explain this process too.
If you have questions, send me an email at [email protected].
I would be happy to hear from you!
Peter


Peter is a solopreneur in Salzburg, Austria, a husband, and a family father. He runs a little publishing company, and blogs about starting and running online businesses. In his spare time, he enjoys hiking with friends and reading the Bible, and sometimes he takes a trip in his roaring old black 2001 Jaguar XJ8.


